Stay Up to Date
Subscribe to our quarterly updates for all the latest MinEx CRC news
Weathering processes can obscure or limit the surface expression of underlying mineralisation, presenting significant challenges in identifying and delineating deposits. These sequences can be characterised effectively through geochemical and mineralogical analyses when coupled with proper data analyses, with particular focus on regolith interfaces, which could exhibit enriched concentrations of key elements in certain intervals indicative of mineralisation.
Mapping and characterising regolith interfaces is a central focus of the MinEx CRC program, aimed at leveraging a range of in situ data to enable near real-time decision-making during drilling campaigns. This approach integrates multivariate analyses of geochemical and mineralogical data derived from techniques such as portable X-ray fluorescence (pXRF), hyperspectral data collected via portable spectrometers or HyLogger™ systems along with petrophysical parameters available from wireline loggings. These datasets, processed using optimised machine learning (ML) algorithms and Data Mosaic™, enhance the identification of significant interfaces within regolith and basement profiles. To further this goal, the decision tree-based workflow for automated interface detection has been integrated into a web application called LithoBound, designed to characterise and define the composition of regolith components.
Workflow methodology
Optimised workflow for rapid cover characterisation and automated detection of regolith/basement interfaces has been discussed in this section. Figure 1 demonstrates three main stages of the streamlined approach, including sampling, data reliability, and data processing through LithoBound which could be implemented during the drilling campaigns. Each step has been also discussed in detail in the following subsections. Rapid analysis of geochemical, spectral, and petrophysical data provides immediate feedback, enabling field teams to dynamically adjust drilling depths or help geologists modify the sampling intervals in response to critical geochemical signatures.
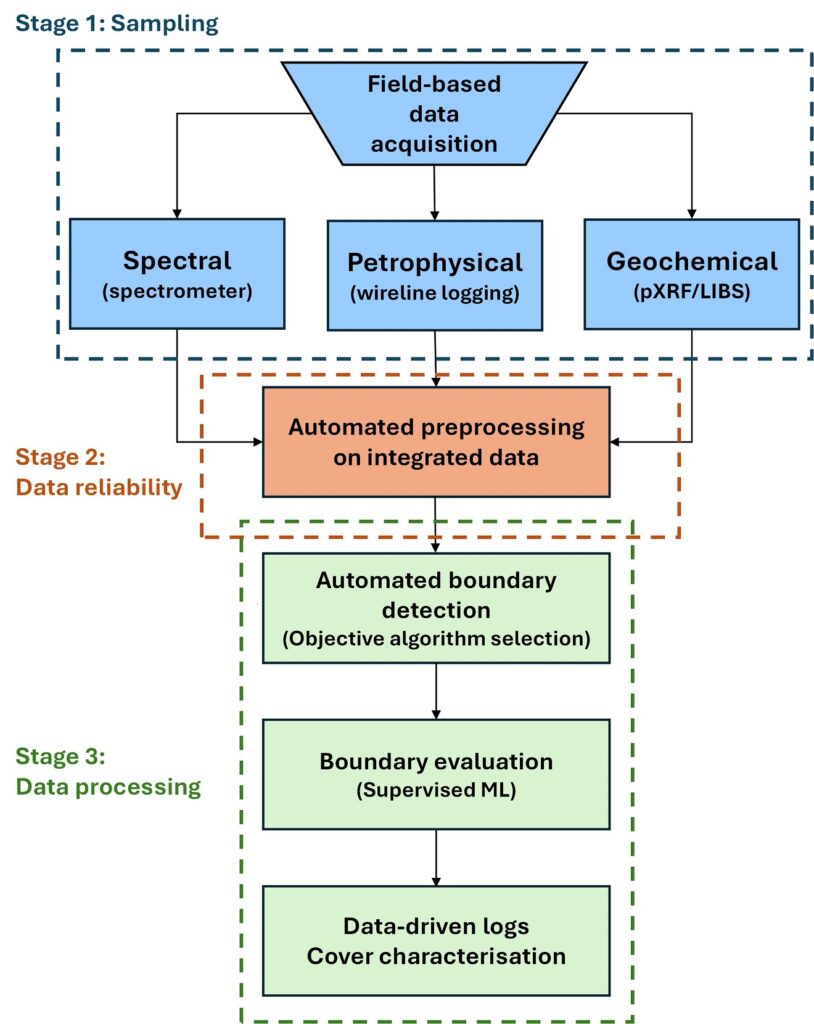
Figure 1. Summary of the rapid cover characterisation and automated boundary detection workflow.
Sampling protocols and data reliability
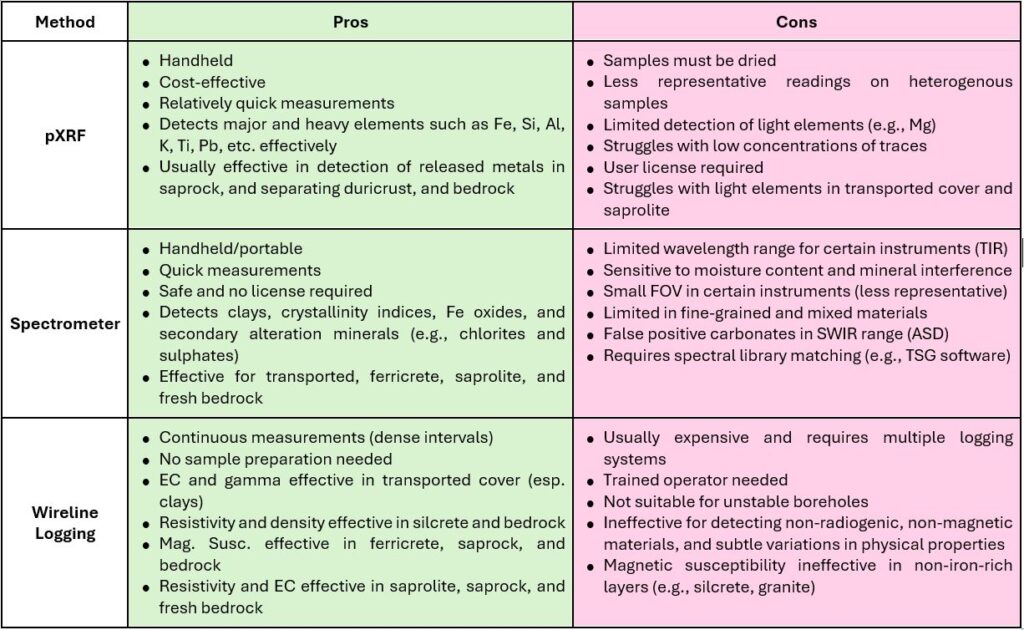
There are strengths and limitations of each filed-based data acquisition technique and their effectiveness in delineation of different components of the weathered profile. When integrating this methodology into drilling workflows, certain limitations must be acknowledged. Samples must be dried prior to scanning with pXRF or spectrometers to ensure accurate and reliable results, potentially delaying real-time data acquisition. Other factors, such as humidity or dust, can also impact the quality of data collected in the field. Despite the constraints of each method at different horizons and regolith settings (Table 1), our studies have shown that geochemical, spectral, and petrophysical data complement each other and the integrated multi-type data could deliver more accurate results in the subsequent boundary detection stage (Zekri et al., 2024).
Table 1: Pros and cons of field-based techniques and their effectiveness in delineation of regolith components.
Data processing – automated boundary detection (LithoBound)
LithoBound web application has been developed for automated detection of regolith/basement interfaces which delivers fast and objective regolith characterisation using data acquired on-site during drilling campaigns. Additionally, LithoBound can process interval data obtained from laboratory-based analytical techniques (e.g., ICP-MS, HyLogger, etc.). This approach provides recommendations for effective interface mapping, fit-for-purpose geochemical sampling, and characterisation, with implications for follow-up detailed analysis.
Figure 2 illustrates the structure of LithoBound, including five stages for the automated detection of interfaces, highlighting key features and outputs:
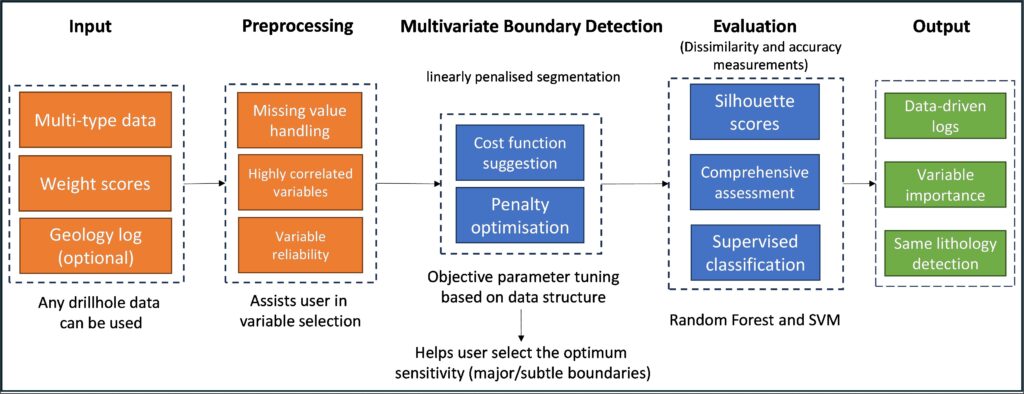
Figure 2. Structure of LithoBound web application, the workflow for automated boundary detection.
This work has been captured through a journal article on the Rapid Analysis of Drill Core Data for Detection of Geological Boundaries
Further work is being undertaken by researchers in MinEx CRC to develop and test this workflow.